Using geographical data from movies
ODMax searches for geographical data in user-provided videos. If these are found, then outcoming stills will be provided with latitude, longitude and elevation coordinates. This notebook demonstrates this workflow and demonstrates how you can plot the data to get an idea of what coverage you have over your 360-degree video extracts.
Note
This notebook requires exiftool to be installed. Please refer to the installation instructions on https://odmax.readthedocs.io if you do not yet have exiftool installed on your system.
Import packages
let’s first import the necessary packages for this notebook. We also make one convenience function to extract coordinates from JPG files later one
[1]:
%matplotlib inline
import os
import odmax
import matplotlib.pyplot as plt
from PIL import Image
from PIL.ExifTags import TAGS, GPSTAGS
import cartopy.io.img_tiles as cimgt
import cartopy.crs as ccrs

def get_exif(fn):
    """Returns a dictionary from the exif data of an PIL Image item. Also converts the GPS Tags"""
    image = Image.open(fn)
    exif_data = {}
    info = image._getexif()
    if info:
        for tag, value in info.items():
            decoded = TAGS.get(tag, tag)
            if decoded == "GPSInfo":
                gps_data = {}
                for t in value:
                    sub_decoded = GPSTAGS.get(t, t)
                    gps_data[sub_decoded] = value[t]
                exif_data[decoded] = gps_data
            else:
                exif_data[decoded] = value
    return exif_data
We need a large enough file to work with. Below we download a file containing 50 FPS data from a GoPro 360 camera platform.
[2]:
!wget https://object-store.rc.nectar.org.au/v1/AUTH_9f7c80bfd20f45bebc780b06c405f0df/asdc-public/GOPR0011_1599383304667.mp4
--2021-12-17 14:26:49--  https://object-store.rc.nectar.org.au/v1/AUTH_9f7c80bfd20f45bebc780b06c405f0df/asdc-public/GOPR0011_1599383304667.mp4
Resolving object-store.rc.nectar.org.au (object-store.rc.nectar.org.au)... 138.44.66.177
Connecting to object-store.rc.nectar.org.au (object-store.rc.nectar.org.au)|138.44.66.177|:443... connected.
HTTP request sent, awaiting response... 200 OK
Length: 505976567 (483M) [video/mp4]
Saving to: ‘GOPR0011_1599383304667.mp4’

GOPR0011_1599383304 100%[===================>] 482.54M  6.84MB/s    in 75s

2021-12-17 14:28:05 (6.47 MB/s) - ‘GOPR0011_1599383304667.mp4’ saved [505976567/505976567]
Let us check if the file is indeed present in the current folder
[3]:
ls
GOPR0011_1599383304667.mp4  conf.py           intro.rst
Makefile                    environment.yml   make.bat
README.rst                  geotags.ipynb     notebooks.rst
_build/                     img/              reprojection.ipynb
api/                        index.rst         requirements.txt
cli.rst                     installation.rst
First, we will use the API to open the file as a odmax.Video object. If geographical information is found, this will be indicated and the first valid and complete point available with a coordinate and time stamp will be displayed with it.
[4]:
import odmax
video_file = "GOPR0011_1599383304667.mp4"
Video = odmax.Video(video_file)
Found first location and time stamp in video on lat: -35.2561223, lon: 149.1008243, elev: 671.833, time: 2020-09-06T07:37:22.580Z
When exiftool is properly installed you should see a first location and time stamp displayed above. The actual gps information is stored in a property called gdf_gps
[5]:
Video.gdf_gps
[5]:
| lat | lon | elev | geometry | |
|---|---|---|---|---|
| 1.599378e+09 | -35.256122 | 149.100824 | 671.833 | POINT (149.10082 -35.25612) |
| 1.599378e+09 | -35.256146 | 149.100826 | 671.918 | POINT (149.10083 -35.25615) |
| 1.599378e+09 | -35.256165 | 149.100816 | 671.571 | POINT (149.10082 -35.25616) |
| 1.599378e+09 | -35.256180 | 149.100805 | 671.506 | POINT (149.10081 -35.25618) |
| 1.599378e+09 | -35.256201 | 149.100783 | 671.062 | POINT (149.10078 -35.25620) |
| ... | ... | ... | ... | ... |
| 1.599378e+09 | -35.258421 | 149.101283 | 627.272 | POINT (149.10128 -35.25842) |
| 1.599378e+09 | -35.258433 | 149.101298 | 626.776 | POINT (149.10130 -35.25843) |
| 1.599378e+09 | -35.258462 | 149.101319 | 626.373 | POINT (149.10132 -35.25846) |
| 1.599378e+09 | -35.258487 | 149.101342 | 626.183 | POINT (149.10134 -35.25849) |
| 1.599378e+09 | -35.258491 | 149.101348 | 626.054 | POINT (149.10135 -35.25849) |
148 rows × 4 columns
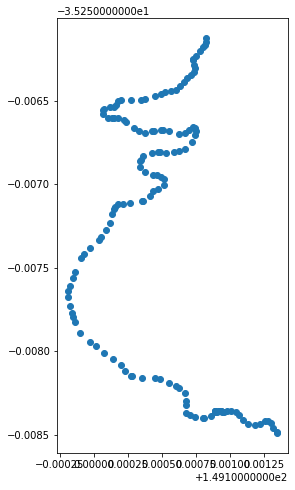
This is a Geopandas DataFrame (i.e. gdf) which holds a geometry. We have a convenience method to plot this
[6]:
Video.plot_gps()
[6]:
<AxesSubplot:>
Let’s look a bit closer at the plotting options
[7]:
help(Video.plot_gps)
Help on method plot_gps in module odmax.api:

plot_gps(geographical=False, figsize=(13, 8), ax=None, crs=None, tiles=None, plot_kwargs={}, zoom_level=8, tiles_kwargs={}) method of odmax.api.Video instance
    Make a simple plot of the gps track in the Video

    :param geographical: bool, use a geographical plot, default False, requires cartopy to be installed
    :param figsize: tuple, passed to plt.figure as figsize
    :param ax: pass an axes that you already have, to add to existing axes
    :param crs: cartopy.crs object, coordinate reference system (default: cartopy.crs.PlateCarree())
    :param tiles: str, name of cartopy.io.img_tiles WMTS WMTS service, default: None, can be e.g. "OSM", "QuadtreeTiles", "GoogleTiles"
    :param zoom_level: int, zoom level for chosen tile service, default 8.
    :param plot_kwargs: dictionary of options to pass to matplotlib.pyplot.plot
    :param tiles_kwargs: dictionary of options to pass to cartopy.axes.add_image
    :return: axes object
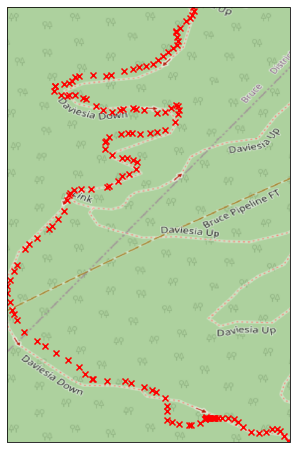
We can use cartopy to further improve the plots and add background WMTS services. Let’s try that with OpenStreetMap at a zoom level of 18 (make sure you install cartopy with conda install cartopy. pip install is very difficult).
[8]:
Video.plot_gps(
    geographical=True,
    tiles="OSM",
    zoom_level=18,
    plot_kwargs={"color": "r", "marker": "x"}
)
/home/docs/checkouts/readthedocs.org/user_builds/odmax/conda/latest/lib/python3.8/site-packages/cartopy/crs.py:245: ShapelyDeprecationWarning: __len__ for multi-part geometries is deprecated and will be removed in Shapely 2.0. Check the length of the `geoms` property instead to get the  number of parts of a multi-part geometry.
  if len(multi_line_string) > 1:
/home/docs/checkouts/readthedocs.org/user_builds/odmax/conda/latest/lib/python3.8/site-packages/cartopy/crs.py:297: ShapelyDeprecationWarning: Iteration over multi-part geometries is deprecated and will be removed in Shapely 2.0. Use the `geoms` property to access the constituent parts of a multi-part geometry.
  for line in multi_line_string:
/home/docs/checkouts/readthedocs.org/user_builds/odmax/conda/latest/lib/python3.8/site-packages/cartopy/crs.py:364: ShapelyDeprecationWarning: __len__ for multi-part geometries is deprecated and will be removed in Shapely 2.0. Check the length of the `geoms` property instead to get the  number of parts of a multi-part geometry.
  if len(p_mline) > 0:
[8]:
<GeoAxesSubplot:>
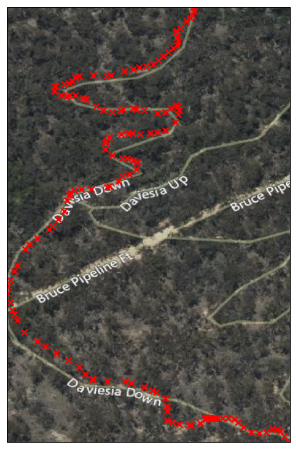
Another option is to use a satellite background by choosing a different WMTS service.
[9]:
Video.plot_gps(
    geographical=True,
    tiles="QuadtreeTiles",
    zoom_level=18,
    plot_kwargs={"color": "r", "marker": "x"}
)
/home/docs/checkouts/readthedocs.org/user_builds/odmax/conda/latest/lib/python3.8/site-packages/cartopy/crs.py:245: ShapelyDeprecationWarning: __len__ for multi-part geometries is deprecated and will be removed in Shapely 2.0. Check the length of the `geoms` property instead to get the  number of parts of a multi-part geometry.
  if len(multi_line_string) > 1:
/home/docs/checkouts/readthedocs.org/user_builds/odmax/conda/latest/lib/python3.8/site-packages/cartopy/crs.py:297: ShapelyDeprecationWarning: Iteration over multi-part geometries is deprecated and will be removed in Shapely 2.0. Use the `geoms` property to access the constituent parts of a multi-part geometry.
  for line in multi_line_string:
/home/docs/checkouts/readthedocs.org/user_builds/odmax/conda/latest/lib/python3.8/site-packages/cartopy/crs.py:364: ShapelyDeprecationWarning: __len__ for multi-part geometries is deprecated and will be removed in Shapely 2.0. Check the length of the `geoms` property instead to get the  number of parts of a multi-part geometry.
  if len(p_mline) > 0:
[9]:
<GeoAxesSubplot:>
Now let’s extract 20 Frames from this track and store the latitudes and longitudes in two arrays. We’ll also store the stills in .jpg files.
[10]:
frames = list(range(1150, 1650, 25))
lons, lats, fns = ([], [], [])
path = "geotest"
# ensure the path exists
if not(os.path.isdir(path)):
    os.makedirs(path)

for f in frames:
    print(f"Extracting frame {f}")
    Frame = Video.get_frame(f)
    # File naming will be automated based on path and prefix. Default prefix is "still"
    fn = Frame.to_file(path)
    # keep track of the files
    fns.append(fn)
    # also store the lat and lon coordinate
    lons.append(Frame.coord.lon)
    lats.append(Frame.coord.lat)
Extracting frame 1150
Extracting frame 1175
Extracting frame 1200
Extracting frame 1225
Extracting frame 1250
Extracting frame 1275
Extracting frame 1300
Extracting frame 1325
Extracting frame 1350
Extracting frame 1375
Extracting frame 1400
Extracting frame 1425
Extracting frame 1450
Extracting frame 1475
Extracting frame 1500
Extracting frame 1525
Extracting frame 1550
Extracting frame 1575
Extracting frame 1600
Extracting frame 1625
We will also read the files back in memory and use a few PIL functions to extract the latitude and longitude coordinates from the .jpg. In this way we can make sure that the locations are written in the .jpgs properly.
[11]:
lons2, lats2 = ([], [])
for fn in fns:
    exif = get_exif(fn)
    l = exif["GPSInfo"]["GPSLatitude"]
    lat = l[0] + l[1]/60. + l[2]/3600
    if exif["GPSInfo"]["GPSLatitudeRef"] == "S":
        lat *= -1
    l = exif["GPSInfo"]["GPSLongitude"]
    lon = l[0] + l[1]/60. + l[2]/3600
    if exif["GPSInfo"]["GPSLongitudeRef"] == "W":
        lon *= -1
    lons2.append(lon)
    lats2.append(lat)
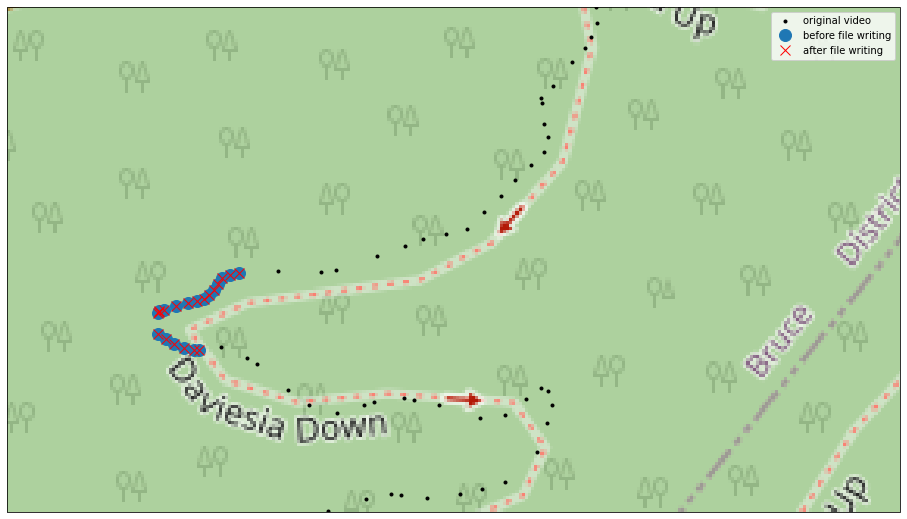
Now plot all the information together to see if odmax accurately managed to geotag the stills.
[12]:
ax = Video.plot_gps(geographical=True, figsize=(16, 10), tiles="OSM", crs=cimgt.GoogleTiles().crs, zoom_level=18, plot_kwargs={"color": "k", "marker": ".", "label": "original video"})
ax.plot(lons, lats, "o", markersize=12, transform=ccrs.PlateCarree(), zorder=2, label="before file writing")
ax.plot(lons2, lats2, "x", markersize=10, color="r", transform=ccrs.PlateCarree(), zorder=3, label="after file writing")
plt.legend()

# retrieve the current counding box in geographical coordinates
bbox = list(ax.get_extent(crs=ccrs.PlateCarree()))
print(bbox)
# make the box a bit more zoomed in
bbox[2] +=0.7*(bbox[3]-bbox[2])
ax.set_extent(bbox, crs=ccrs.PlateCarree())
/home/docs/checkouts/readthedocs.org/user_builds/odmax/conda/latest/lib/python3.8/site-packages/cartopy/crs.py:245: ShapelyDeprecationWarning: __len__ for multi-part geometries is deprecated and will be removed in Shapely 2.0. Check the length of the `geoms` property instead to get the  number of parts of a multi-part geometry.
  if len(multi_line_string) > 1:
/home/docs/checkouts/readthedocs.org/user_builds/odmax/conda/latest/lib/python3.8/site-packages/cartopy/crs.py:297: ShapelyDeprecationWarning: Iteration over multi-part geometries is deprecated and will be removed in Shapely 2.0. Use the `geoms` property to access the constituent parts of a multi-part geometry.
  for line in multi_line_string:
/home/docs/checkouts/readthedocs.org/user_builds/odmax/conda/latest/lib/python3.8/site-packages/cartopy/crs.py:364: ShapelyDeprecationWarning: __len__ for multi-part geometries is deprecated and will be removed in Shapely 2.0. Check the length of the `geoms` property instead to get the  number of parts of a multi-part geometry.
  if len(p_mline) > 0:
[149.0998107, 149.1013483, -35.25849089999999, -35.2561223]